Brain Imaging Study (MRI)
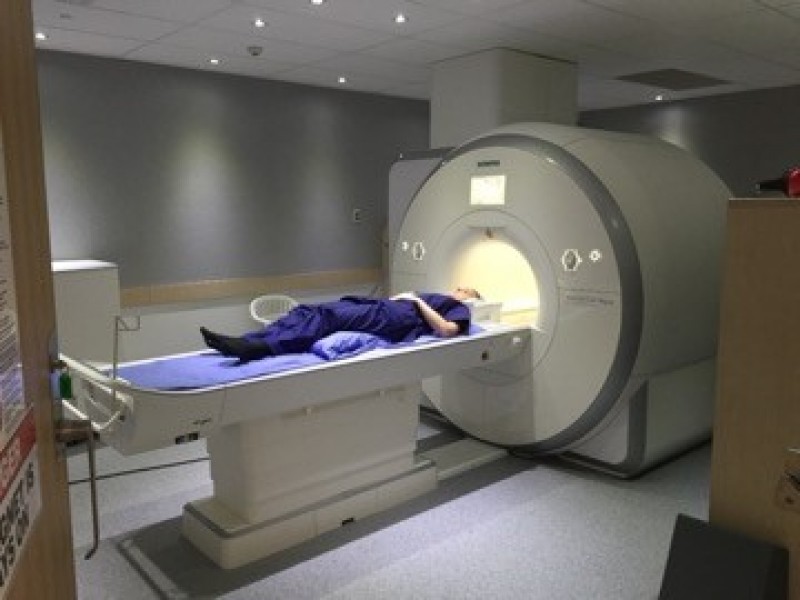
At the last assessment – age 45, we did MRI scans of Study member brains for the very first time. In this section, we answer some commonly asked questions. (Click on each question to see the answer.)
The MRI study would not be possible without the expertise of Prof Ahmad Hariri and his team at Duke University.
- (1) Why did the Dunedin Study do MRI brain scans this time and not before?
-
As with many things, the timing was right. We had been thinking about, and planning for this project for many years. Obtaining funding was a major challenge and we were fortunate that the US National Institute of Aging were keen on getting MRI data on a mid-life general population sample, ideally one that had been followed longitudinally!
In our mid-40s we are approximately half-way through our predicted average lifespan – literally middle-aged. A strong focus of the study moving forward is on the aging process, and trying to answer the question of how we can grow old in as healthy a way as possible. Most studies of aging, not surprisingly, look at people of the age that they are interested in. Our approach is to use an entire lifetime’s data to look back as far as early childhood and see if there are things that we can know about well in advance that will influence the aging process. After all, it is better to try to head off problems before they arrive than deal with them when they do. By scanning Study member brains at middle-age we can get a good picture of things before the aging process gets properly underway.
- (2) What is MRI?
-
MRI stands for Magnetic Resonance Imaging. It is a technique for looking inside the body that, unlike X-rays, PET, or CT scans, does not involved radiation. The first experimental scans of human body parts were done in the 1970s, and widespread use began in the 1980s. What makes so useful is that it can give us very detailed pictures without some of the drawbacks (like radiation) of other scan types. The other thing is its versatility, which allows it to do other jobs, as well as taking pictures of internal organs - for example detecting cancers and other diseases, mapping blood vessel pathways, and in the case of the brain, indirectly measuring activity.
- (3) How does MRI work?
-
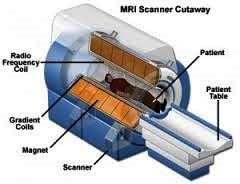
The magnetic part will be a bit familiar to anyone who has had an MRI and been asked lots of questions about whether they have any metal in their body. The walls of the MRI scanner contain very powerful electromagnets (coils of wire that create a magnetic field when electric current is passed through them). There is a main magnetic field that runs through the scanner tube (a bit like a giant bar magnet). This magnetic field is always on, except when the scanner is being repaired. (This is the reason that walking into the scanner room wearing cast-iron underwear is a bad idea!) In the walls of the scanner there are other electromagnets that only switch on during scans and have a number of different functions.
The resonance part refers to the way in which the scanner’s magnets cause atoms in the brain (or other body part) to absorb energy. Different types of tissue (e.g., blood, muscle, fat, brain tissue) release this energy in different ways, and the energy released is measured by antennas in the helmet worn when in the MRI scanner (for more information see question 8). These measurements are then turned into an image by computer software that shows the different tissues as different levels of brightness. This is a completely harmless process. (For more detail on how MRI scans work click here.)
- (4) What are the different types of MRI scan we used?
-
The two most common types of MRI scans are structural and functional (fMRI), and within those two categories there are many different types of scans with different purposes.Structural scans, as the name suggests, allow us to measure such things as the volume of different brain areas (for more information see question 9).Functional scans indirectly measure brain function, often while the brain’s owner is doing some sort of task or game. You might be surprised to learn that the scanner does this, not by measuring the electrical activity of nerves, but by tracking where blood gets sent in the brain. (For more detail click here.)There are also other more specialized scan types, some of which we used.We did quite a few different types of scanning during each session, although Study members probably only remember certain ones that were distinctive in some way, such as one where the table vibrated. (For more details on the scans we used click here.)
- (5) What were the noises that the scanner made and why did the bed vibrate in one scan?
-
The loud noises, that we did our best to muffle and distract Study members from, happen when some of the electromagnets switch on and off, causing them to physically vibrate a little. (For more detail click here.) Each scan type has a particular pattern of magnet switching, which is why each scan type had its own unique sound. When the table vibrated, this was because for that scan, the pattern in which the magnets switched on and off did not just make audible sound, but also caused the bed to resonate (the same idea as a very loud noise outside your house causing the windows to rattle).
- (6) Could you actually see what a brain was doing or thinking during the functional MRI scans?
-
As amazing as that sounds, no we could not. The pictures that we create from Study members' fMRI scans with bright colours are actually digitally coloured in during the analysis process AFTER completing the scans. The different colours correspond to different amounts of activity associated with different tasks. (For more information click here)
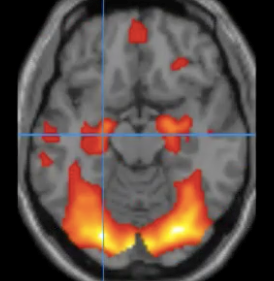
An “activation map” from an fMRI scan showing areas of greater brain activity.
- (7) Why the big fuss about metal, and did tiny piercings really have to be removed?
-
Although MRIs are very safe, they can be made unsafe if you take metal into the scanner that could be attracted to the magnet. That is why we were so keen on asking questions about metal, why we asked some Study members to have an X-ray to check for metal fragments in the eyes, and why we wanted jewellery and piercings removed and even makeup that could contain glitter*. It is also why we asked Study members to change – so that they did not accidently carry their keys, etc. into the scanner in a pocket.

However, some Study members were scanned with bits of metal inside their bodies, but this was usually orthopaedic hardware like metal pins in joints and this causes no problems. They are usually made of titanium alloys which are not attracted to magnets and are pretty firmly locked in place.
Some Study members were also scanned with piercings in place. While this is not usually a safety issue because the piercing can not really go anywhere, depending on what it is made from it may wiggle around which would be very unpleasant for its owner. This is why we advised piercings be removed if possible.
A second potential problem with metal is that, in theory it can heat up in the scanner. This is why we sometimes asked Study members to let us know if they felt their own bit of metal warming up at all. Thankfully, we are not aware of anyone experiencing this.
A third reason is to do with data quality. Metal disrupts the magnetic field in the region around it, and blacks out the scan image in that spot. Sometimes it is not a problem but in theory an eyebrow ring, for example, could blot out the front part of a Study member's brain in the scan. Not a safety concern, but would have been a real shame if they were to bravely put up with the whole thing and then we could not use the data.
Because Study members took the whole metal thing seriously and did their best to answer all our safety questions accurately we did not experience any problems at all with metal.
Photo of Richie Poulton modelling the latest in metal-free blue pyjamas.
*Actually we are told that the glitter is not a hazard but apparently is hard to clean off the inside of the scanner.
- (8) Why wear the special helmet?
-
The helmet contains very sensitive antennas that pick up the energy from your brain (for more information see question 3) that is then measured, then turned into pictures. This energy is actually very weak and so having the antenna very close to your head makes it easier to pick up. Also, having lots of antennas spread over the helmet speeds up the process of the scanner’s computer software working out where the different parts of the brain are.
- (9) What does "brain structure" mean?
-
When you read descriptions of our findings, you will see that the main things we have reported so far are differences in brain structure. (For a summary of findings click here.) However, while that might sound like some of our brains look completely different to others, this is not the case at all. Unless someone has had surgery or an injury that has damaged a section of their brain, our brains look basically the same to the eye. It is only when we analyse the measurements we have taken that we uncover subtle differences.
The main things we can measure are the size of different brain areas, and how well those areas are connected. The cerebral cortex (or just “cortex”) is the outer part of the brain, and even though it is only a few millimetres thick, it contains tens of billions of brain cells (neurons). We measure the cortex volume, thickness and surface area. The cortex is sometimes called grey-matter, as the neurons in it give it a darkish colour, although not necessarily in an MRI picture. (For more detail click here).
The other part of the brain that we are interested in is called white-matter and lies underneath the cortex. This is the brains “wiring” – bundles of fibres that extend from the grey-matter and allow different bits of the brain to talk with each other. The whitish colour comes from the fatty insulation that covers these fibres. We use the DWI scan to produce the striking colour-coded pictures you see on this webpage, and to get an idea of how well these fibres run between different parts of the brain. (For more detail on types of scans click here)
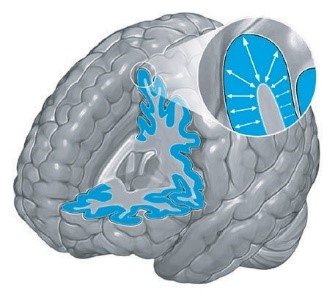
Cutaway diagrams of the brain showing cortex (grey-matter) thickness and surface area (from d’Arbeloff et al. 2020)
- (10) Why did some Study members have a second MRI scan?
-
The reason we re-scanned 20 Study members was to see whether an individual’s scan measurements had changed much in the couple of months in between scans. We are living creatures, so we would expect some variation between scans of the same person, but if there is too much then it becomes difficult to compare the data from different Study members, or between two sessions for the same Study members.
To take a simplified example using only two people (you can imagine the same thing though with all Study members involved), let’s say we are interested in differences in people’s brain-activity while playing a particular fMRI game. In our first scan, brain activity is higher in person A than person B. But when we do a second scan, activity is higher in person B than person A, despite the fact that the game was identical in all scans. This means that there must be other factors out of our control that affect brain activity a lot and vary from scan to scan (e.g. sleep quality the night before, measurement error, change in game strategy, etc.), making it difficult to tell whether the game itself had a bigger or smaller effect on person A’s brain activity versus person B.
We invited those Study members who had had their first scans over the previous month or so. It took a while to get to 20 second scans, as lots of Study members could not come back for various reasons (which is fair enough– we are grateful for one scan!).
- (11) What did you find out from the data, and what does it mean for individual Study members?
-
The amount of information that we got from the MRIs was huge and so far, this has led to 16 papers being published, with several more being written or submitted to journals for peer-review (where the paper is sent to experts for their opinion about what more needs to be done before it can be published). Papers will continue to be written between now and the next interview phase, with new published findings added to our website.
So far we have discovered links between brain structure and: walking speed, biological age, antisocial behaviour, childhood blood-lead levels, educational level and IQ, mental health, and cardiovascular fitness. We have also used the fMRI data to improve the way MRI research is done. (For more detail on these findings click here.)
So how do these results affect Study members personally? This might seem like a strange answer, but not that much at the moment. The strength of the Dunedin Study is in gathering data from lots of Study members and looking for general patterns in that data. While that is really useful for working out what is happening on average across a population of people, it is not possible to apply it to any one particular Study member. (For an example of this click here.) The other thing to realise is that we can not be confident at this stage whether the differences in brain structure that we see between Study members cause the other differences in their lives (e.g., mental health), or whether it is the other way around. (For more detail on this click here.)
- (12) Did you see any medical problems in anyone’s brain?
-
This is a question that Study members often ask. After all, most of us have at one time or another wondered whether there is anything to worry about. Although we emphasized that this was a research MRI, our process did include every scan being checked by a radiologist. Minor abnormalities are common in mid-life, and we contacted many Study members to let them know. The most common things spotted by the radiologists, were White-Matter Hyperintensities (WMHs). In T2-weighted scans, these areas in the brain’s white-matter (for more information see question 9) appear brighter, due to their higher water content, than the surrounding white-matter. They are a normal part of aging, but can also be a sign of things like hypertension (high blood-pressure). If a Study member had more WMHs than we might have expected for age 45, we let them know so that they could see their GP for a check-up. In a much smaller number of Study members we found problems which were more serious, but early identification and referral to the health system, meant the outcomes for those people were better than they likely would have been otherwise.
- (13) Are we going to do MRI scans again next time?
-
Yes! We are currently completing scans for our Age 52 Assessment Phase (2024-2026).
- FUN MRI FACTS
-
- The magnetic field strength of the machine that we used is 3-Tesla* which is roughly the same as if you covered the scanner tube in fridge magnets a thousand layers deep. The main magnetic field of a 3-Tesla scanner is 60,000 times the Earth's magnet field, and the strongest MRI scanners in the world have magnets above 10 Tesla.
- Very powerful MRI machines have a magnetic field that can levitate a frog.
- One of the most infamous papers to be published with fMRI data involved scanning a dead fish to show that if the data are not analysed carefully you can end up thinking that there is increased brain activity when there is none!
- We know that the games that we got you to play could be a bit frustrating, but at least we did not make your brains more active by putting a live snake into the scanner room with you or putting your foot in a box that you thought had a tarantula in it.
- For the magnets to work, they must be ridiculously cold. This is done using liquid helium which is -271° Celsius. This is colder than the lowest temperature ever measured by a weather station on Earth (-89° in Antarctica) and even colder than the lowest temperature on Pluto (-223°). In fact, it is only just above absolute zero (-273°) which is the point where something has no heat at all. Helium is extracted from underground pockets that also contain natural-gas and its single largest commercial use is in MRI scanners (no, not party balloons).
- People have been scanned while doing a variety of activities – including playing jazz and having sex. Presumably not at the same time.
- Remember the weird noises that the different scans made? If you work in MRI research and have lots of spare time, you can program the scanner to play part of a Deep Purple song.
*1 Tesla is equal to 1 Weber per square meter. Don’t you feel better now?